
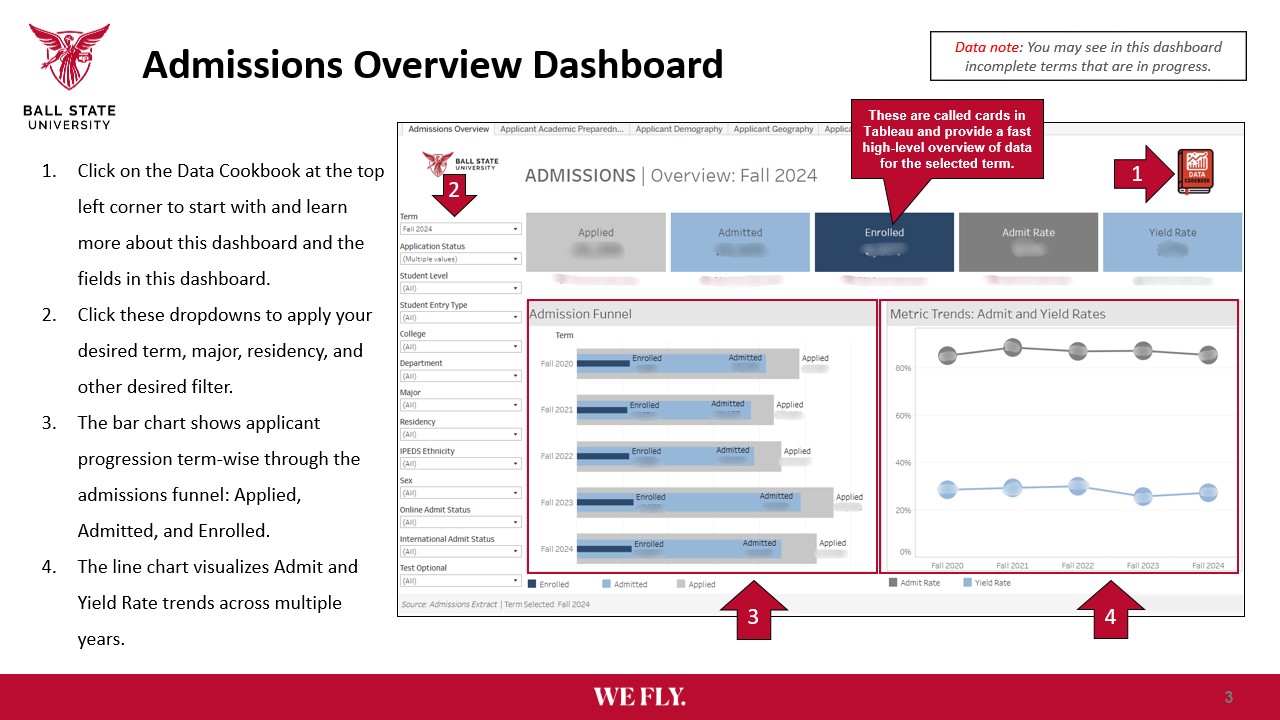
The Admissions Dashboard is a powerful tool for exploring how students move from application to enrollment. It brings together applicant trends, academic preparedness, demographics, geography, and term-to-term comparisons into one interactive experience.
This walkthrough is designed to help you navigate the dashboard with confidence. Each slide highlights a different section, explains what you are seeing, and shows how filters and metrics work together to uncover meaningful insights.
The PowerPoint has also been animated and can be viewed in Presentation Mode for the full guided experience. Click to Download- Admissions Dashboard Walkthrough
You will see how to:
- Track applied, admitted, and enrolled trends
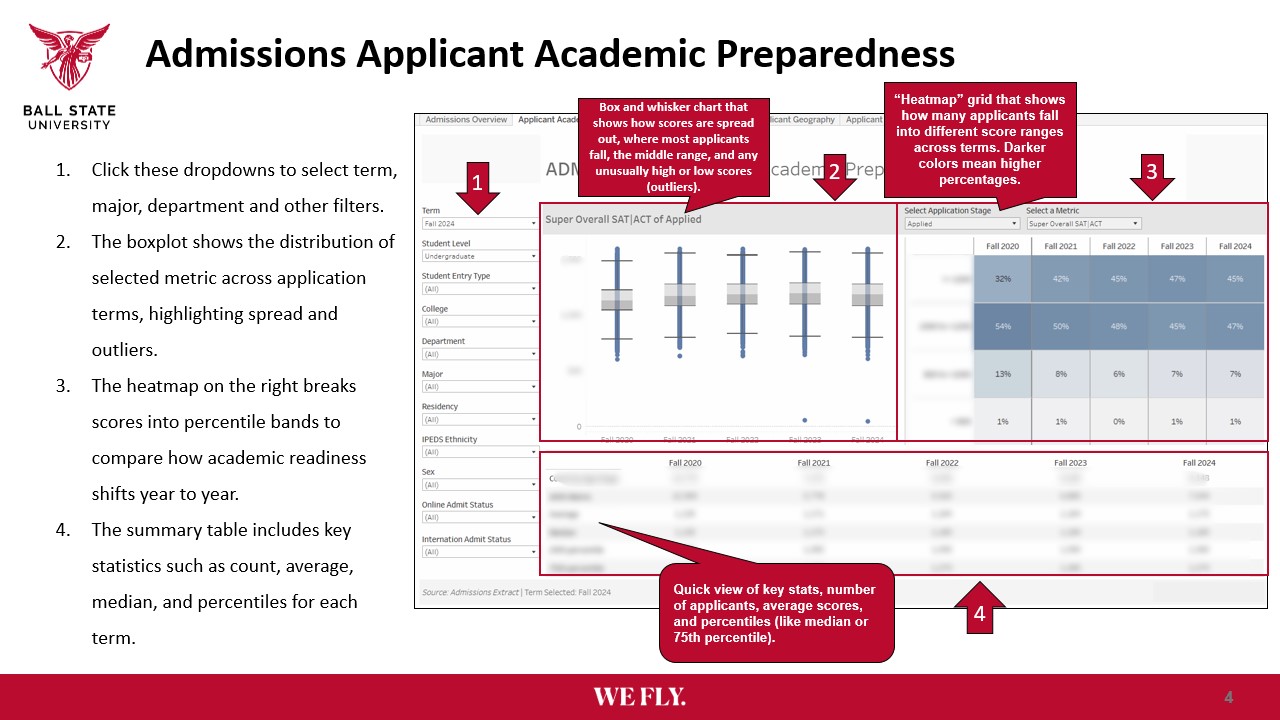
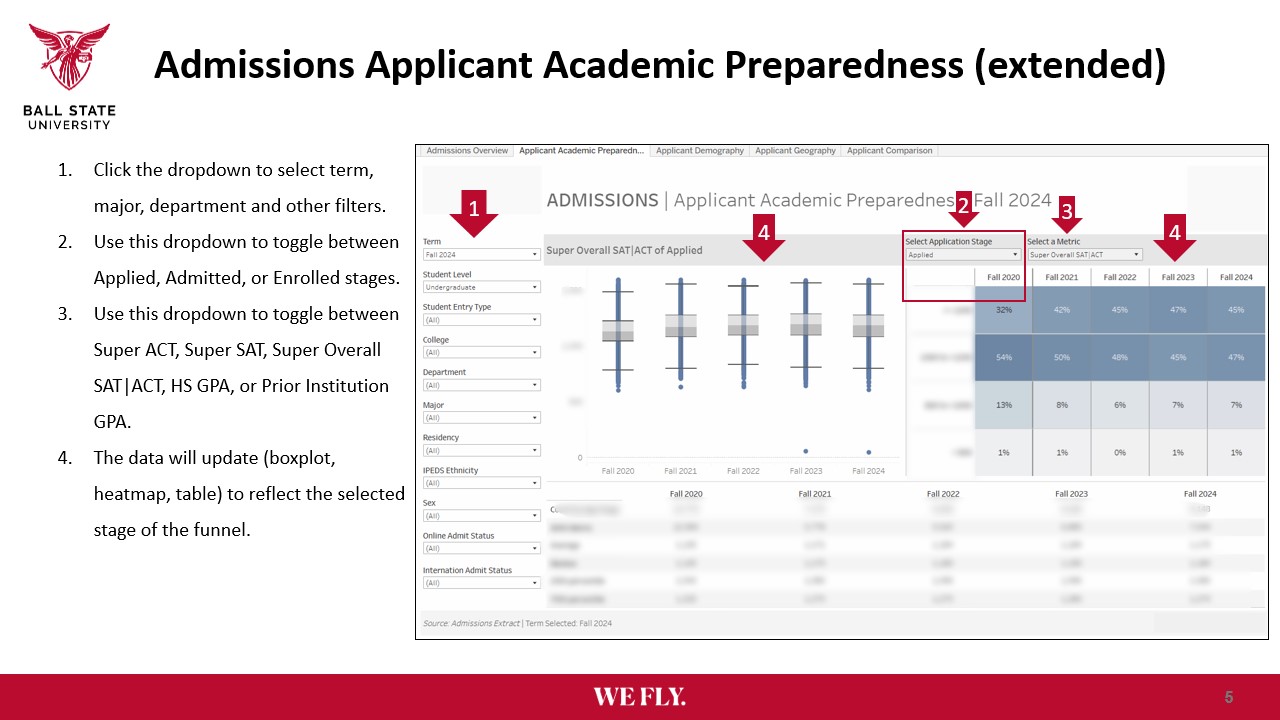
- Explore applicant academic readiness over time
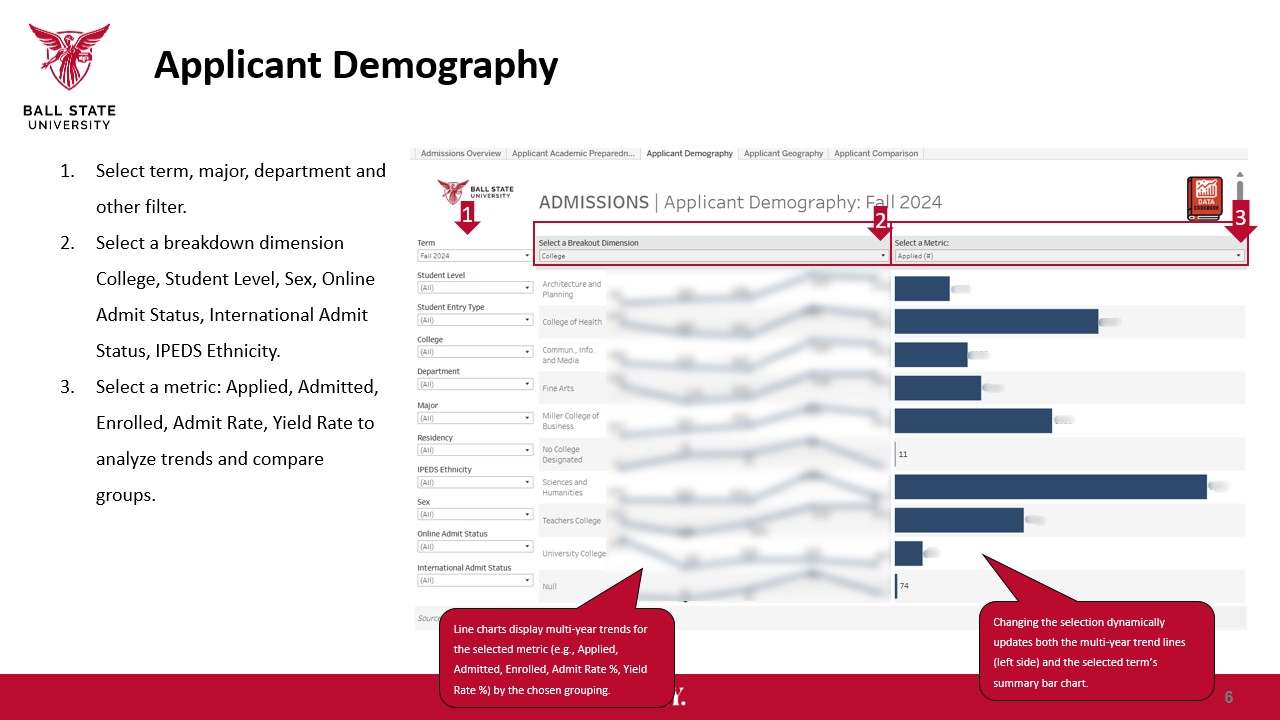
- Compare student groups across key demographics
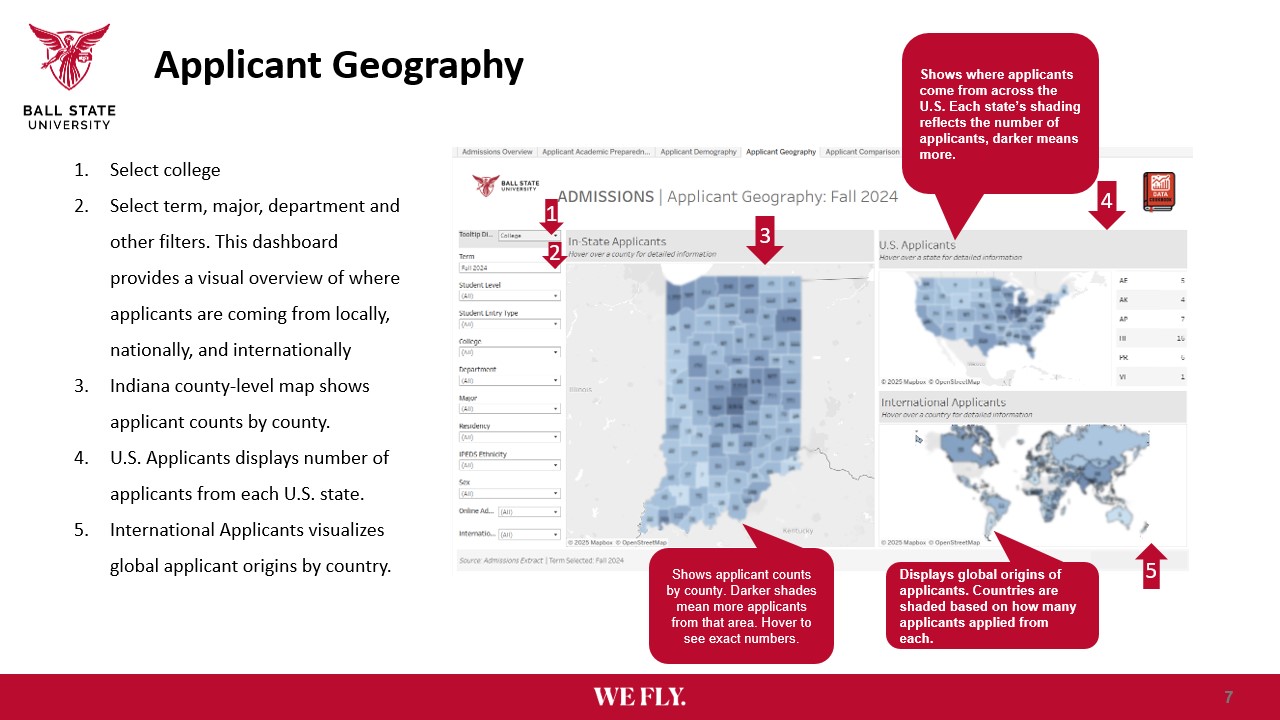
- Visualize where applicants are coming from
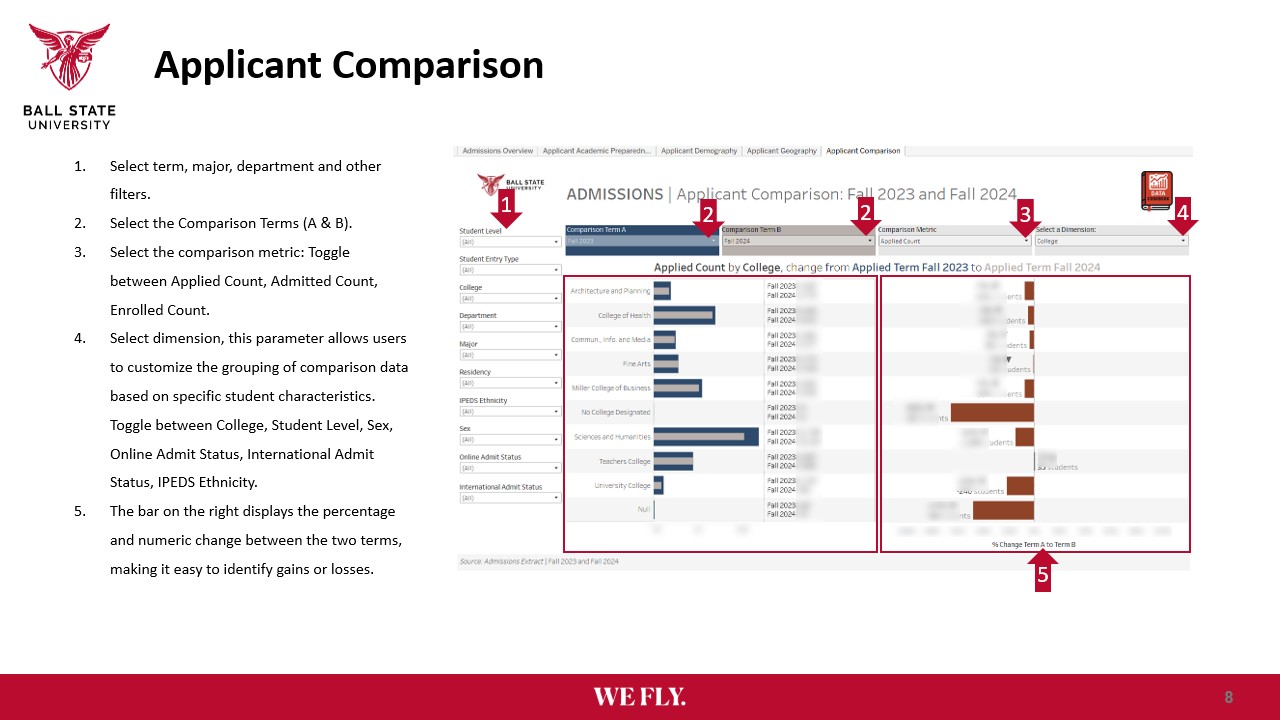
- Measure change between two terms
STEP 1
STEP 2
STEP 3
STEP 4
STEP 5
STEP 6
Use this guide as a companion while clicking through the dashboard. The goal is not just to look at data, but to understand what it is telling you.
Discover more from Data Insider
Subscribe to get the latest posts sent to your email.