
Although often overshadowed by first-year retention, sophomore retention is a meaningful indicator of student progress. This blog post presents an analysis of second-to-third-year enrollment patterns at Ball State, highlighting factors that support continued enrollment. The analysis includes 7,649 Fall 2020–2022 first-time students who returned for a second year. The project builds on a project initiated by a Data Literacy Advisory group.
Key terms used in this report:
Persisted: A student who continues enrollment from one academic year to the next at the same institution.
Stopped Out: A student who temporarily or permanently leaves the university without transferring to another institution.
Transferred: A student who leaves the university and enrolls at a different college or university.
Odds Ratio (OR): A measure that compares the odds (the chance of something happening versus not happening) of an event between two groups. In this context, it shows how much more or less likely a student is to return for a third year based on a specific factor. An odds ratio above 1 means higher odds of returning; below 1 means lower odds.
Z-statistic: A value that helps indicate whether a variable is related to the outcome in a regression model. Higher values suggest a stronger relationship with retention.
Significance (p-value): A value that indicates how likely it is that a result could have occurred by chance. A p-value below 0.05 is typically considered statistically significant.
Pseudo R²: A value that gives a general sense of how well the logistic regression model explains sophomore retention. Unlike R² in linear regression, Pseudo R² doesn’t represent an exact percentage, but the value in this analysis suggests a reasonably good fit for the data.
Why Sophomore Retention Matters
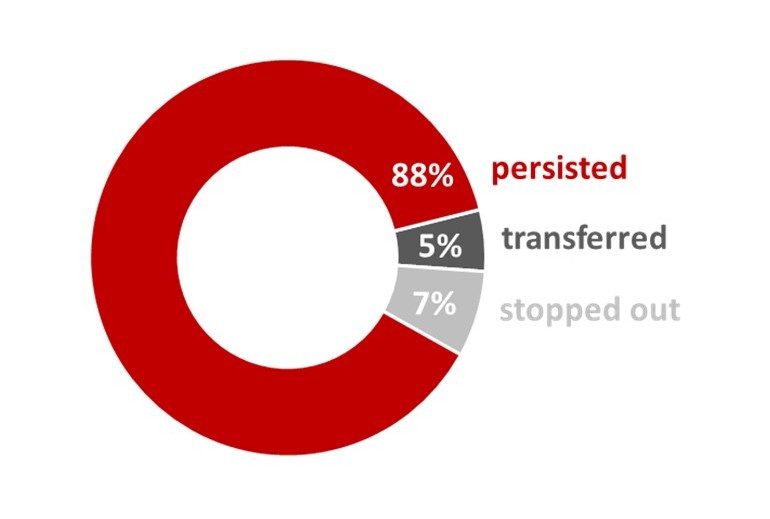
While 88% of sophomores persisted for their third year, 12% either transferred or stopped out. That’s about 300 students per class who depart after their second year, many of whom stop out altogether rather than transfer to a different institution. Understanding why they leave and how to support them can help close that gap.
Figure 1: Year 2 Retention Breakdown
Key Factors that Influence Sophomore Retention
- Student Characteristics
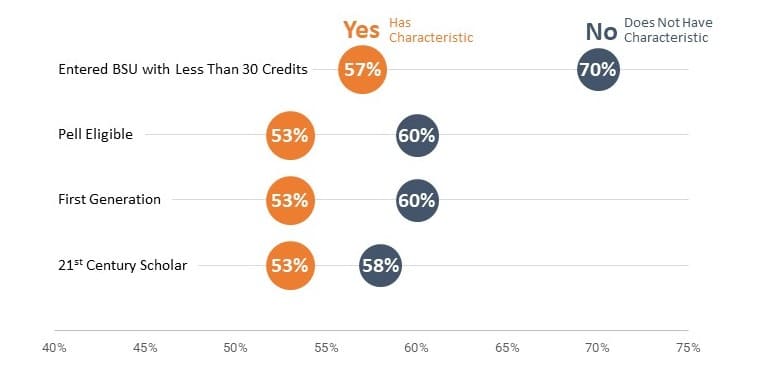
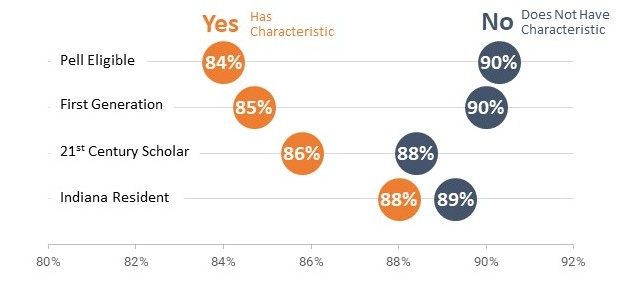
A range of student characteristics and academic variables are associated with sophomore retention. To start, retention was lower for Pell-eligible and first-generation students compared to their peers, as shown below in Figure 2. While some groups had similar outcomes, these two groups showed modest but significant gaps, indicating a need for continued support into the second year.
Figure 2: Sophomore Retention Rate by Select Characteristics
- Academic Progress
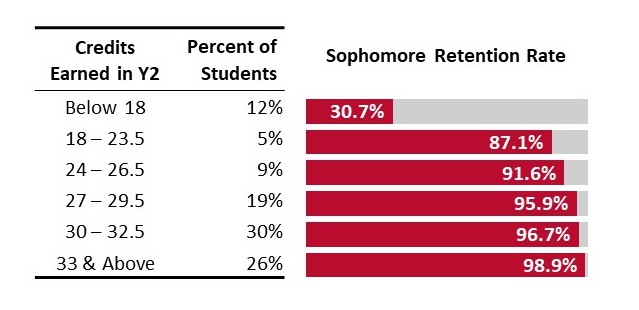
Academic achievement was one of the most powerful predictors of persistence. Students with a GPA of less than 2.0 or who had accumulated fewer than 30 earned credits after their second year were much less likely to re-enroll. GPA and credit accrual remain critical markers of success as students progress beyond their first year.
Figure 3: Sophomore Retention Rate by Cumulative GPA
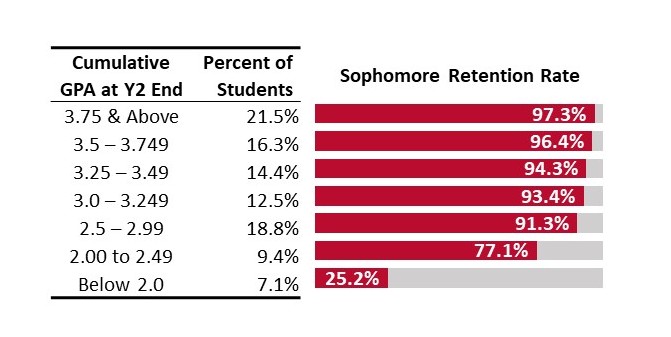
Figure 4: Sophomore Retention Rate by Credits Earned
- Engagement Through High-Impact Practice Courses
Students who had completed at least one High-Impact Practice (HIP) course, like study abroad, research, or service learning, were more likely to remain enrolled. Surprisingly, the largest gains were between students who took zero HIP courses and those who took only one. Yet, Pell-eligible, first-generation students who entered with less than 30 credits were less likely to engage with HIPs.
Figure 5: Sophomore Retention Rate by Number of HIP Courses
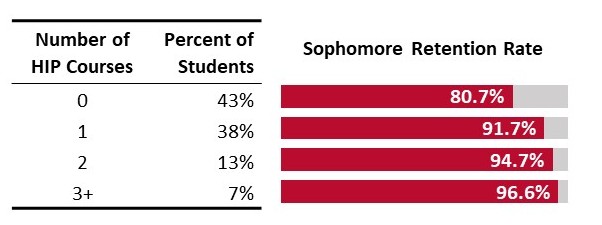
Figure 6: HIP Course Participation in Year 2 by Characteristics
What the Regression Data Model Reveals
When variables are considered together in a logistic regression model, cumulative GPA and credits earned in Year 2 emerge as the strongest predictors of sophomore retention. Students with stronger academic momentum, reflected in higher GPA and greater credit accumulation, were significantly more likely to persist. For example, each one-point increase in cumulative GPA (on a 4.0 scale) was associated with a 69% increase in the odds of returning. Non-Indiana residents, male students, and those who entered with 30 or more credits also had higher odds of returning than their counterparts. Participation in a High Impact Practice course was also positively associated with retention, even after controlling for other variables.
Table 1: Summarized Logistic Regression Results
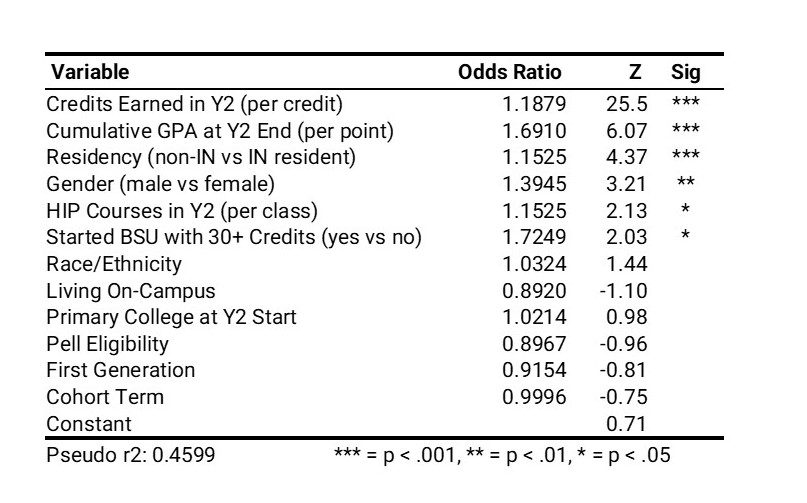
Although Pell eligibility was not a statistically significant predictor in the model, Pell-eligible students tended to have lower GPAs and earn fewer credits, variables that have an ultimate impact on retention.
Comparing Year 1 vs Year 2 Predictors
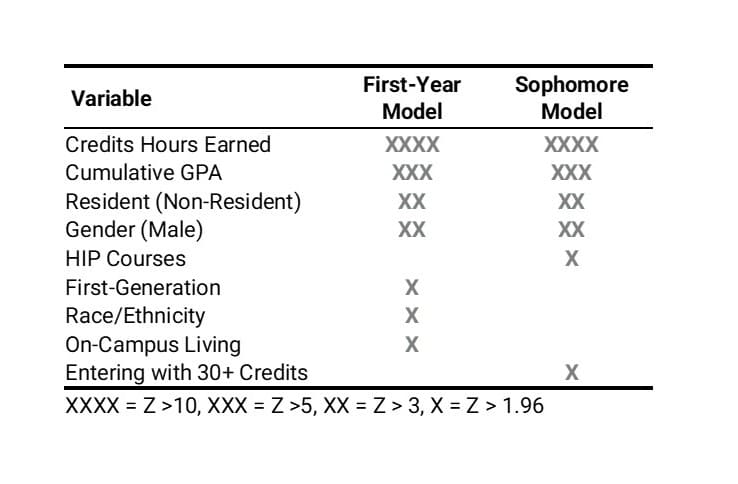
To better understand how the drivers of student persistence evolve over time, we compared predictors of first-year retention (from first to second year) with those influencing sophomore persistence (from second to third year). To summarize these patterns, Table 2 highlights which variables were statistically significant predictors of retention in each model and how strongly they were associated with persistence, based on their Z-statistics. Several variables were significant in both models. Academic momentum, measured by credit accumulation and GPA, was strongly associated with persistence in both years. Notably, High Impact Practice (HIP) course participation was only a significant predictor in the sophomore year, highlighting the importance of engagement opportunities beyond the first year.
In contrast, demographic variables such as Pell eligibility and first-generation status were significant predictors in the first-year model but not in the sophomore model. This shift suggests that early gaps in persistence may be largely shaped by differences in academic performance by the second year, highlighting the importance of early academic support and continued engagement initiatives.
Table 2: Summarized Predictors of Persistence in Year 1 and Year 2 Models
Note: (More ……)
Recommendations to Improve Sophomore Retention
Based on these findings, we suggest the following strategies:
- Support Academic Progress: Identify and assist students who are falling behind in GPA or credit progression in a proactive manner.
- Promote HIP Courses: Promote more sophomores, particularly those from underrepresented groups, to take at least one HIP course.
- Provide Sophomore-Oriented Engagement: Design programs that cater to the unique needs of students in their second year, including career planning and support for belonging.
- Monitor Trends: Continue to track key indicators for subgroups to assess the effectiveness of interventions and make adjustments as necessary.
This research builds on a project established by the Data Literacy Advisory group. Special appreciation to advisory members Jackie Buckrop, David Frye, Michael Lane, and Andy Morrow for their thoughtful input.
Stay tuned for more updates on our data-informed efforts to support student success.
Analysis and modeling were carried out by Joseph Finke, Research Associate. Faidat Bello, Graduate Assistant formatted the narrative and refined the visuals. The Data Literacy Advisory Group offered valuable guidance throughout the project.
Discover more from Data Insider
Subscribe to get the latest posts sent to your email.